Keynote Speakers
We have two excellent keynote speakers arranged for Diagrams 2012:
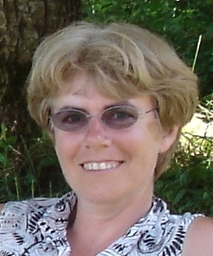
Catherine Plaisant is Senior Research Scientist at the Human-Computer Interaction Lab of the University of Maryland Institute for Advanced Computer Studies. She earned a Doctorat d'Ingénieur degree in France and joined the HCIL in 1987. She has written over 100 refereed technical publications on diverse subjects such as of information visualization, evaluation methods, electronic health record interfaces, digital libraries, online help, etc. She co-authored with Ben Shneiderman the 4th and 5th Editions of Designing the User Interface, one of the major books on the topic of Human-Computer Interaction.
She enjoys working with multidisciplinary teams on designing and evaluating new interface technologies that are useable and useful. Research contributions range from focused user interaction techniques (e.g. Excentric Labeling) to innovative visualizations (such as LifeLines for personal records or SpaceTree for hierarchical data exploration) and interactive search interface techniques such as Query Previews. Those interaction techniques have been carefully validated with user studies and are finding applications in industry, government information systems and digital libraries.
Talk title: Life on the Line: Interacting with Temporal Event Sequence Representations
Sequences of events are part of people's life, their travel, hospital visits, even web browsing experiences. Specifying temporal queries to explore collections of event sequences can be challenging even for skilled computer professionals. We will review a series of visualization techniques developed at the Human-Computer Interaction lab over the years to handle temporal data, with a particular focus on the benefits - and challenges - of interaction during the analysis process. Our novel strategies allow for aligning records on important events, ranking, and filtering combined with grouping of results to find common or rare events. Other approaches explore query-by-example, or methods to aggregate thousands of event sequences. Video demonstrations will focus on electronic health record data. Finally we will discuss the methods we use to evaluate the usefulness of our interactive visualizations through case studies developed in collaboration with clinical researchers.
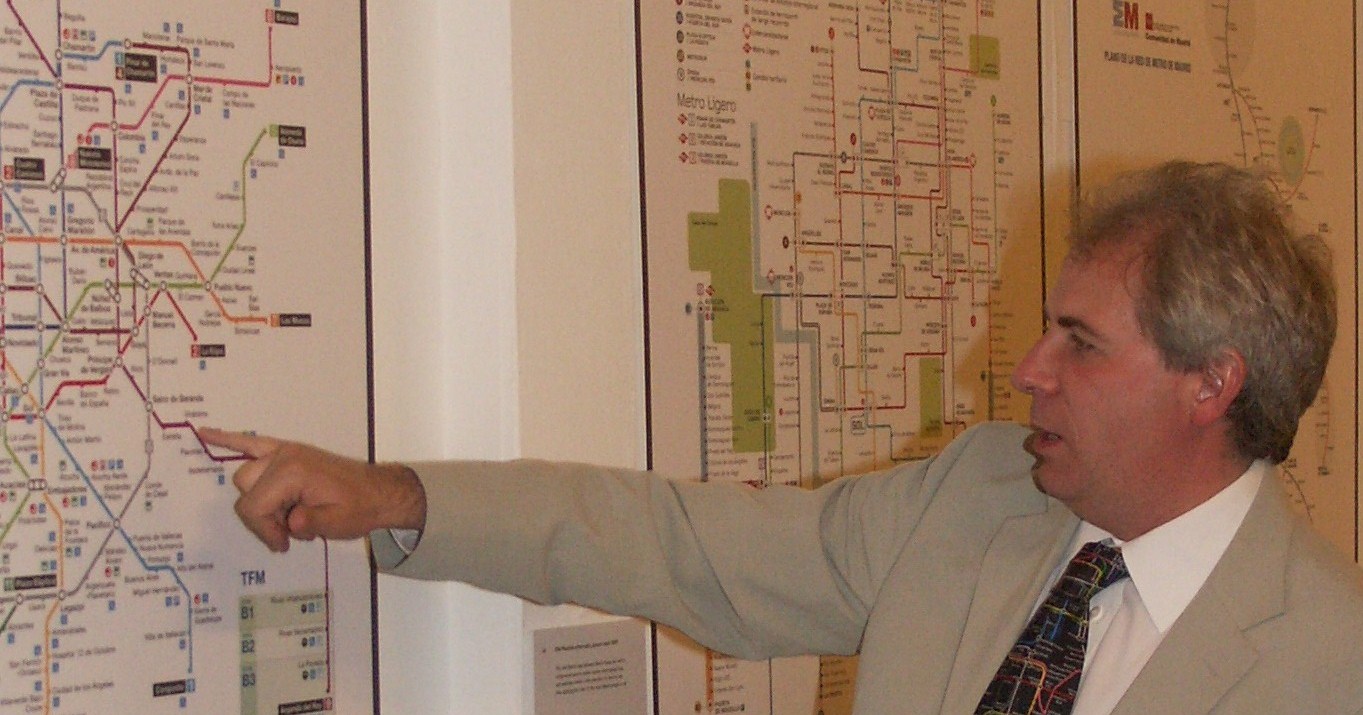
Maxwell Roberts obtained a degree (1988) and PhD (1991) in psychology from the University of Nottingham, and has researched into reasoning, problem solving and intelligence. He began to take an interest in schematic transport network maps twelve years ago, and since then has been developing ideas about good design, based upon findings from cognitive psychology. He designs maps that break traditional rules, and subjects them to usability studies, often with surprising results. An exhibition of his work has toured venues in England and overseas. In conjunction with this, his book, 'Underground Maps Unravelled', is due for publication in Spring 2012.
Talk title: Transport schematics: usability, aesthetics, and evaluation
Ever since the 1930s, there has been a growing trend towards the use of schematic maps to show transport networks around the world. Typically, these use horizontal, vertical, and 45-degree diagonals only, and topography is distorted. With growing network complexity worldwide, it is no longer clear that the use of such design rules guarantees attractive usable designs. In this presentation, I will explore why schematic networks can assist the user from a psychological perspective, the circumstances in which traditional rules are misused, or can break down altogether, and alternative approaches to creating schematics. Several novel designs have been evaluated in usability studies, and our findings also show that subjective user ratings of maps are not correlated with objective measures of performance.